%20--%3e%3cdefs%3e%3cstyle%3e%20.st0%20{%20fill:%20%237c6a59;%20}%20%3c/style%3e%3c/defs%3e%3cpath%20class='st0'%20d='M621.9,102c-.5,0-.9-.2-1.3-.6-.3-.4-.5-.9-.4-1.5l1.5-12.3c.2-1.3-.2-2.6-1.1-3.6-.8-.9-2-1.5-3.2-1.5H17.4l3.5-14.3h602.9c.5,0,.9.2,1.3.6.3.4.5.9.4,1.5l-1.5,12.3c-.2,1.3.2,2.6,1.1,3.6.8.9,2,1.5,3.2,1.5h598.1c5.4,0,9.8-4.4,9.8-9.9s-4.4-9.9-9.8-9.9h-596.3c-.5,0-.9-.2-1.3-.6-.3-.4-.5-.9-.4-1.5l1.5-12.3c.2-1.3-.2-2.6-1.1-3.6-.8-.9-2-1.5-3.2-1.5H23.5C10.3,48.1,0,37.4,0,24.2S2.4,11.8,6.9,7.3C11.3,2.8,17.2.2,23.5,0h.6s616,0,616,0c.5,0,.9.2,1.3.6.3.4.5.9.4,1.5l-1.5,12.3c-.2,1.3.2,2.6,1.1,3.6.8.9,2,1.5,3.2,1.5h576.5c13.3,0,24.2,10.9,24.2,24.2s-1.4,9.5-4.1,13.5l-.7,1,1,.8c5.7,4.6,9,11.5,9,18.8,0,13.2-10.3,23.8-23.5,24.2h-.6s-604.5,0-604.5,0h0ZM24.2,14.3c-5.4,0-9.8,4.4-9.8,9.9s4.4,9.9,9.8,9.9h607.8c.5,0,.9.2,1.3.6.3.4.5.9.4,1.5l-1.5,12.3c-.2,1.3.2,2.6,1.1,3.6.8.9,2,1.5,3.2,1.5h584.8c3.1,0,6.1-1.5,7.9-4,1.9-2.6,2.4-5.8,1.5-8.9-1.2-4-5.1-6.8-9.4-6.8h-582.9c-.5,0-.9-.2-1.3-.6-.3-.4-.5-.9-.4-1.5l1.5-12.3c.2-1.3-.2-2.6-1.1-3.6-.8-.9-2-1.5-3.2-1.5H24.2Z'/%3e%3c/svg%3e)
Research
Raw data access, IRB-friendly workflows, and reproducible signal quality for academic and clinical studies.
Our Difference
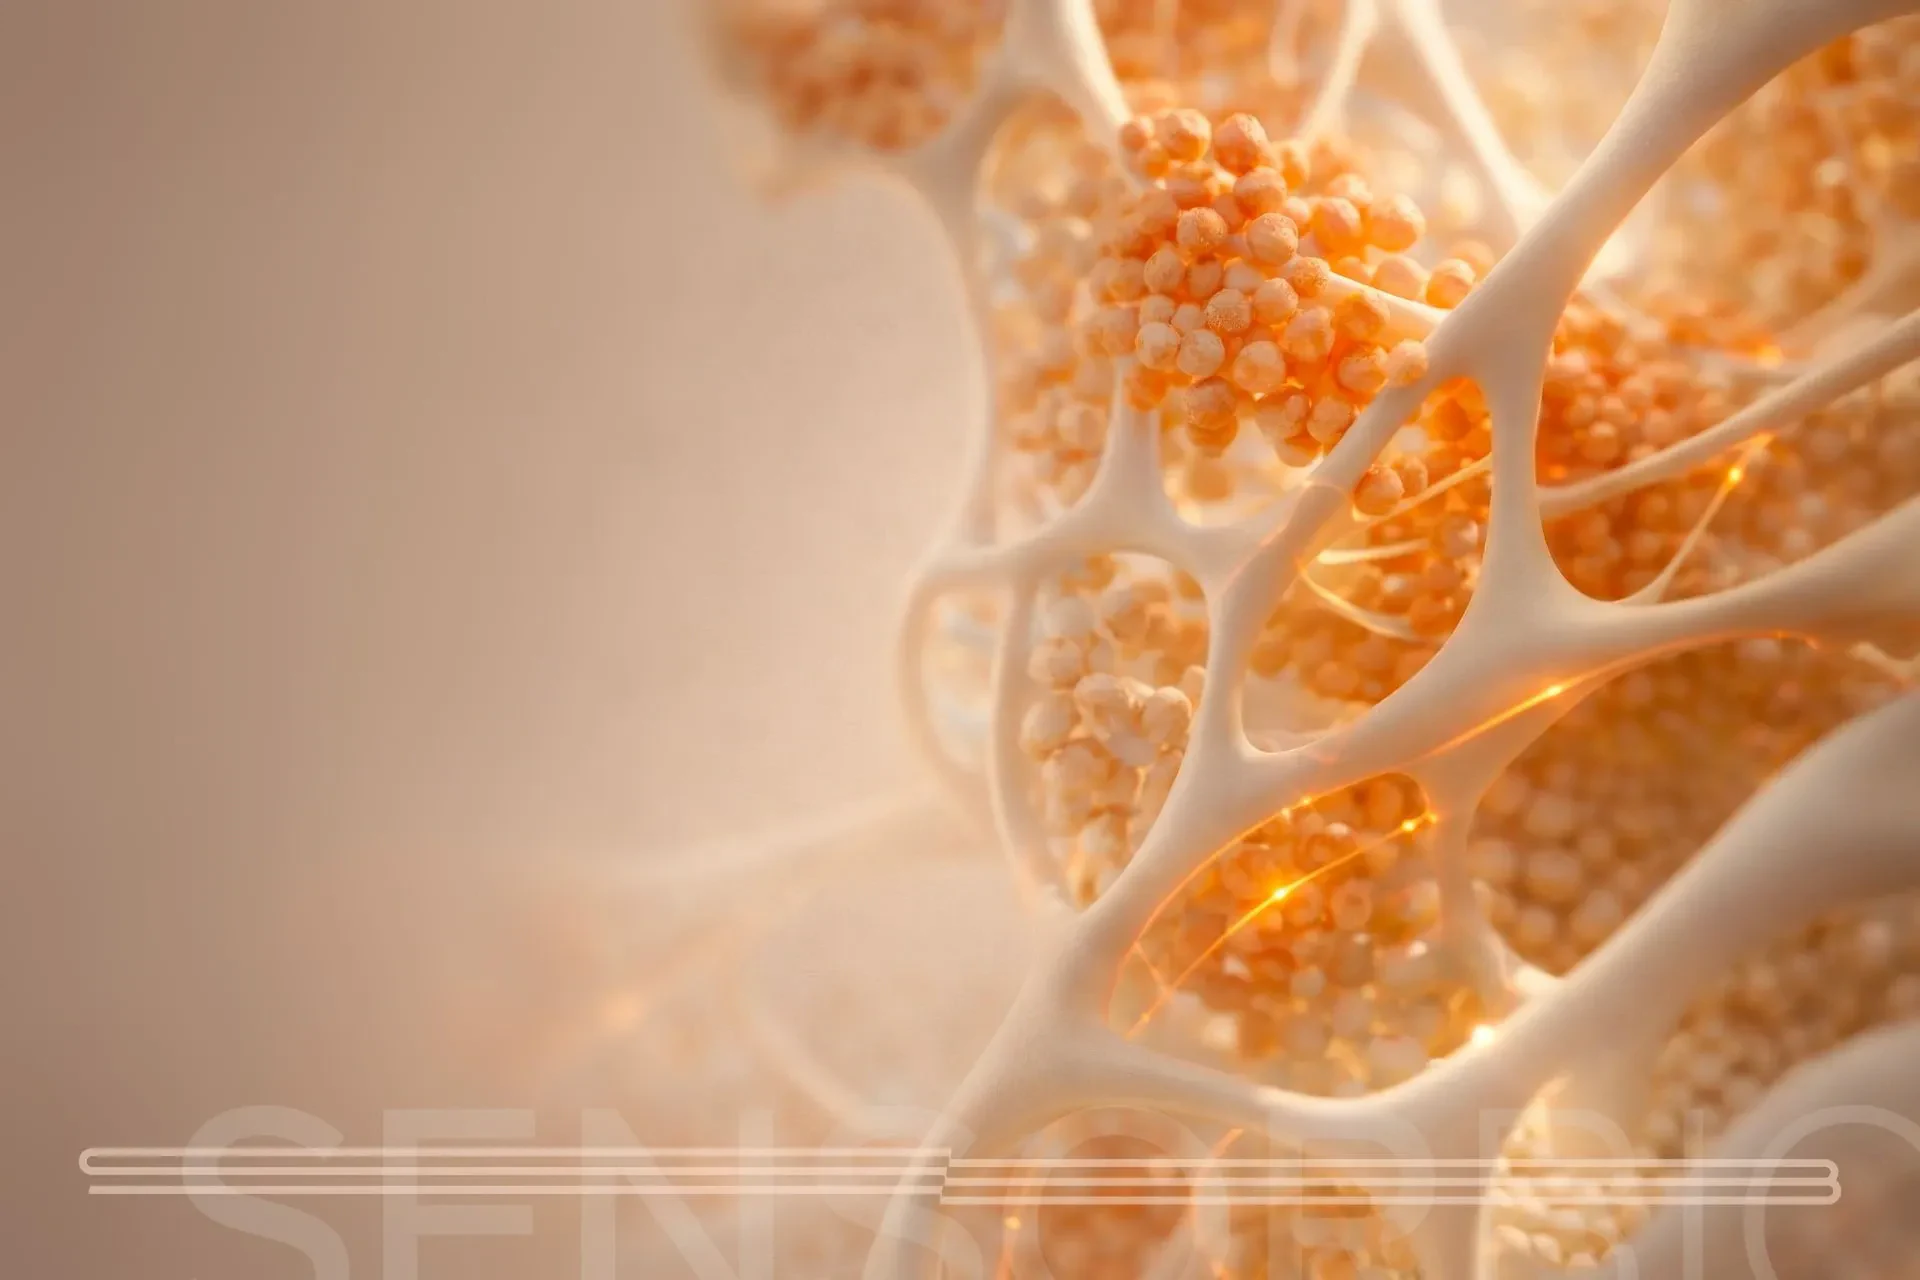
Sensor Bio captures continuous, longitudinal physiological signals and makes them available as trusted, research-grade data. We do not obscure, aggregate, or lock away the signal. We provide the foundation others build upon.
This is not a dashboard.
This is infrastructure.
Modern health systems, researchers, and enterprises are surrounded by data — yet still operate with blind spots. Most wearables capture snapshots. Most platforms aggregate away the signal. Most systems react after risk becomes disease.
Prevention fails when the underlying truth of the human body remains unseen.
Capabilities
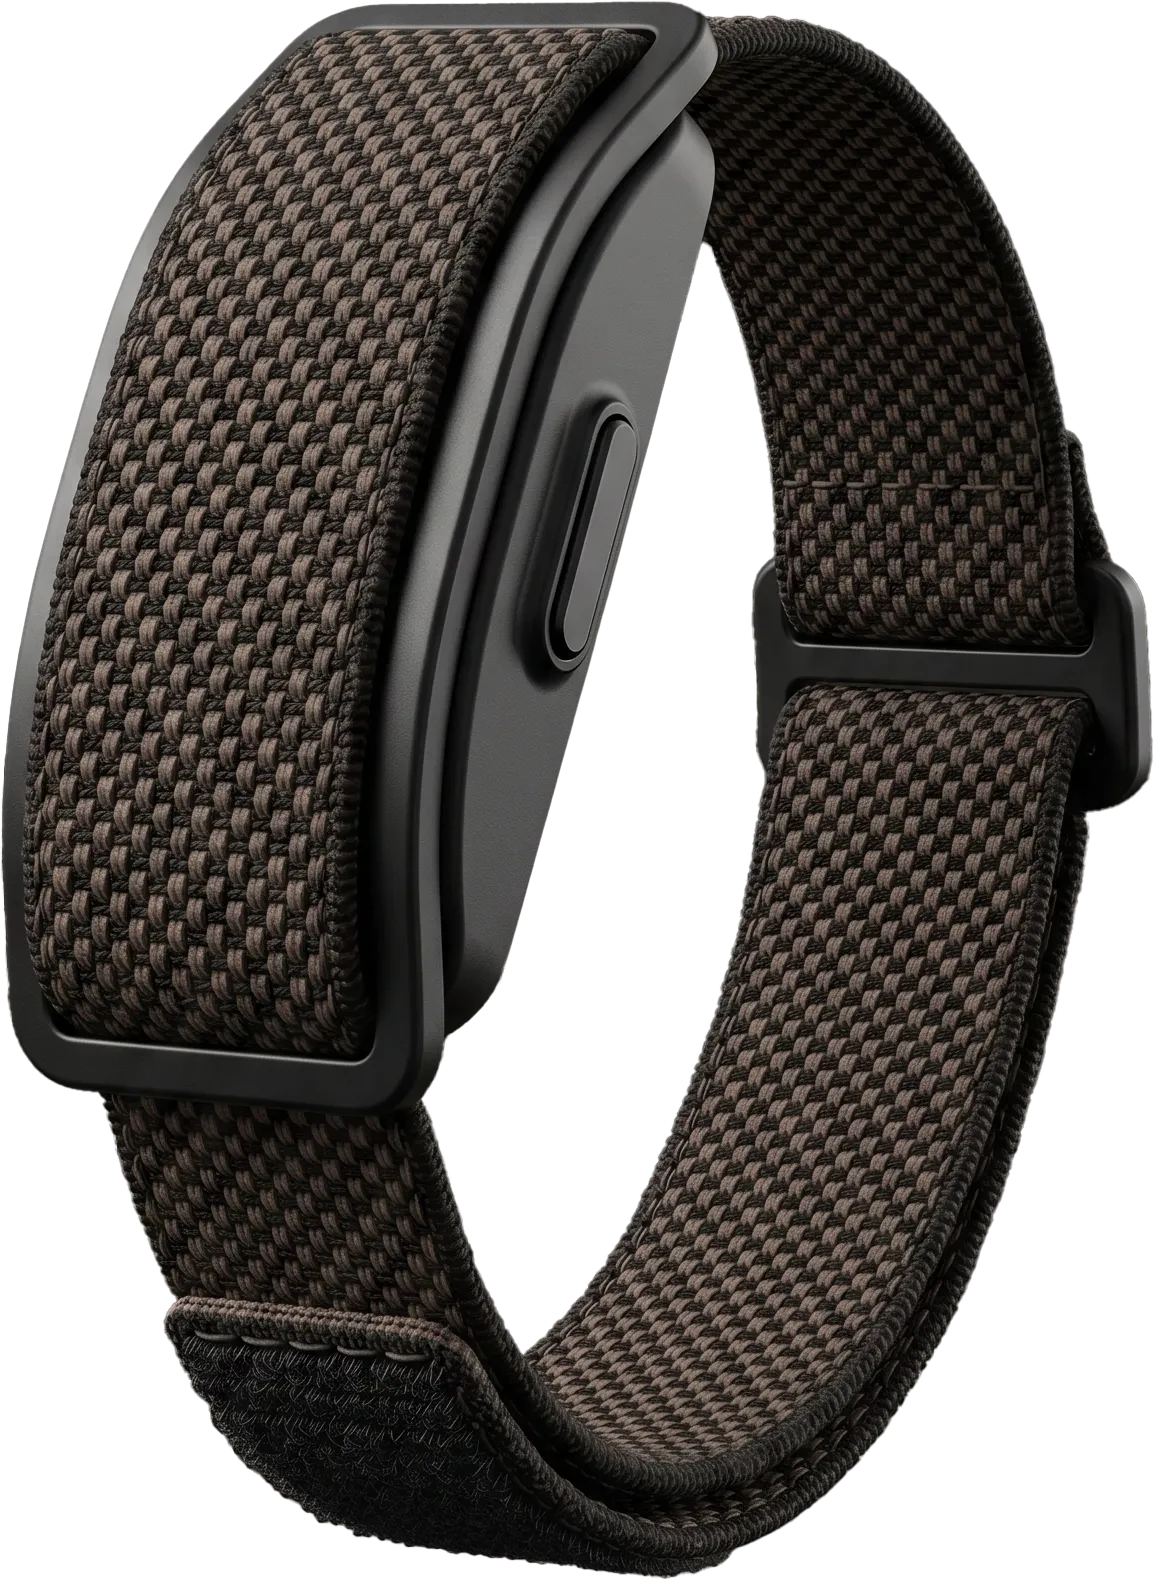
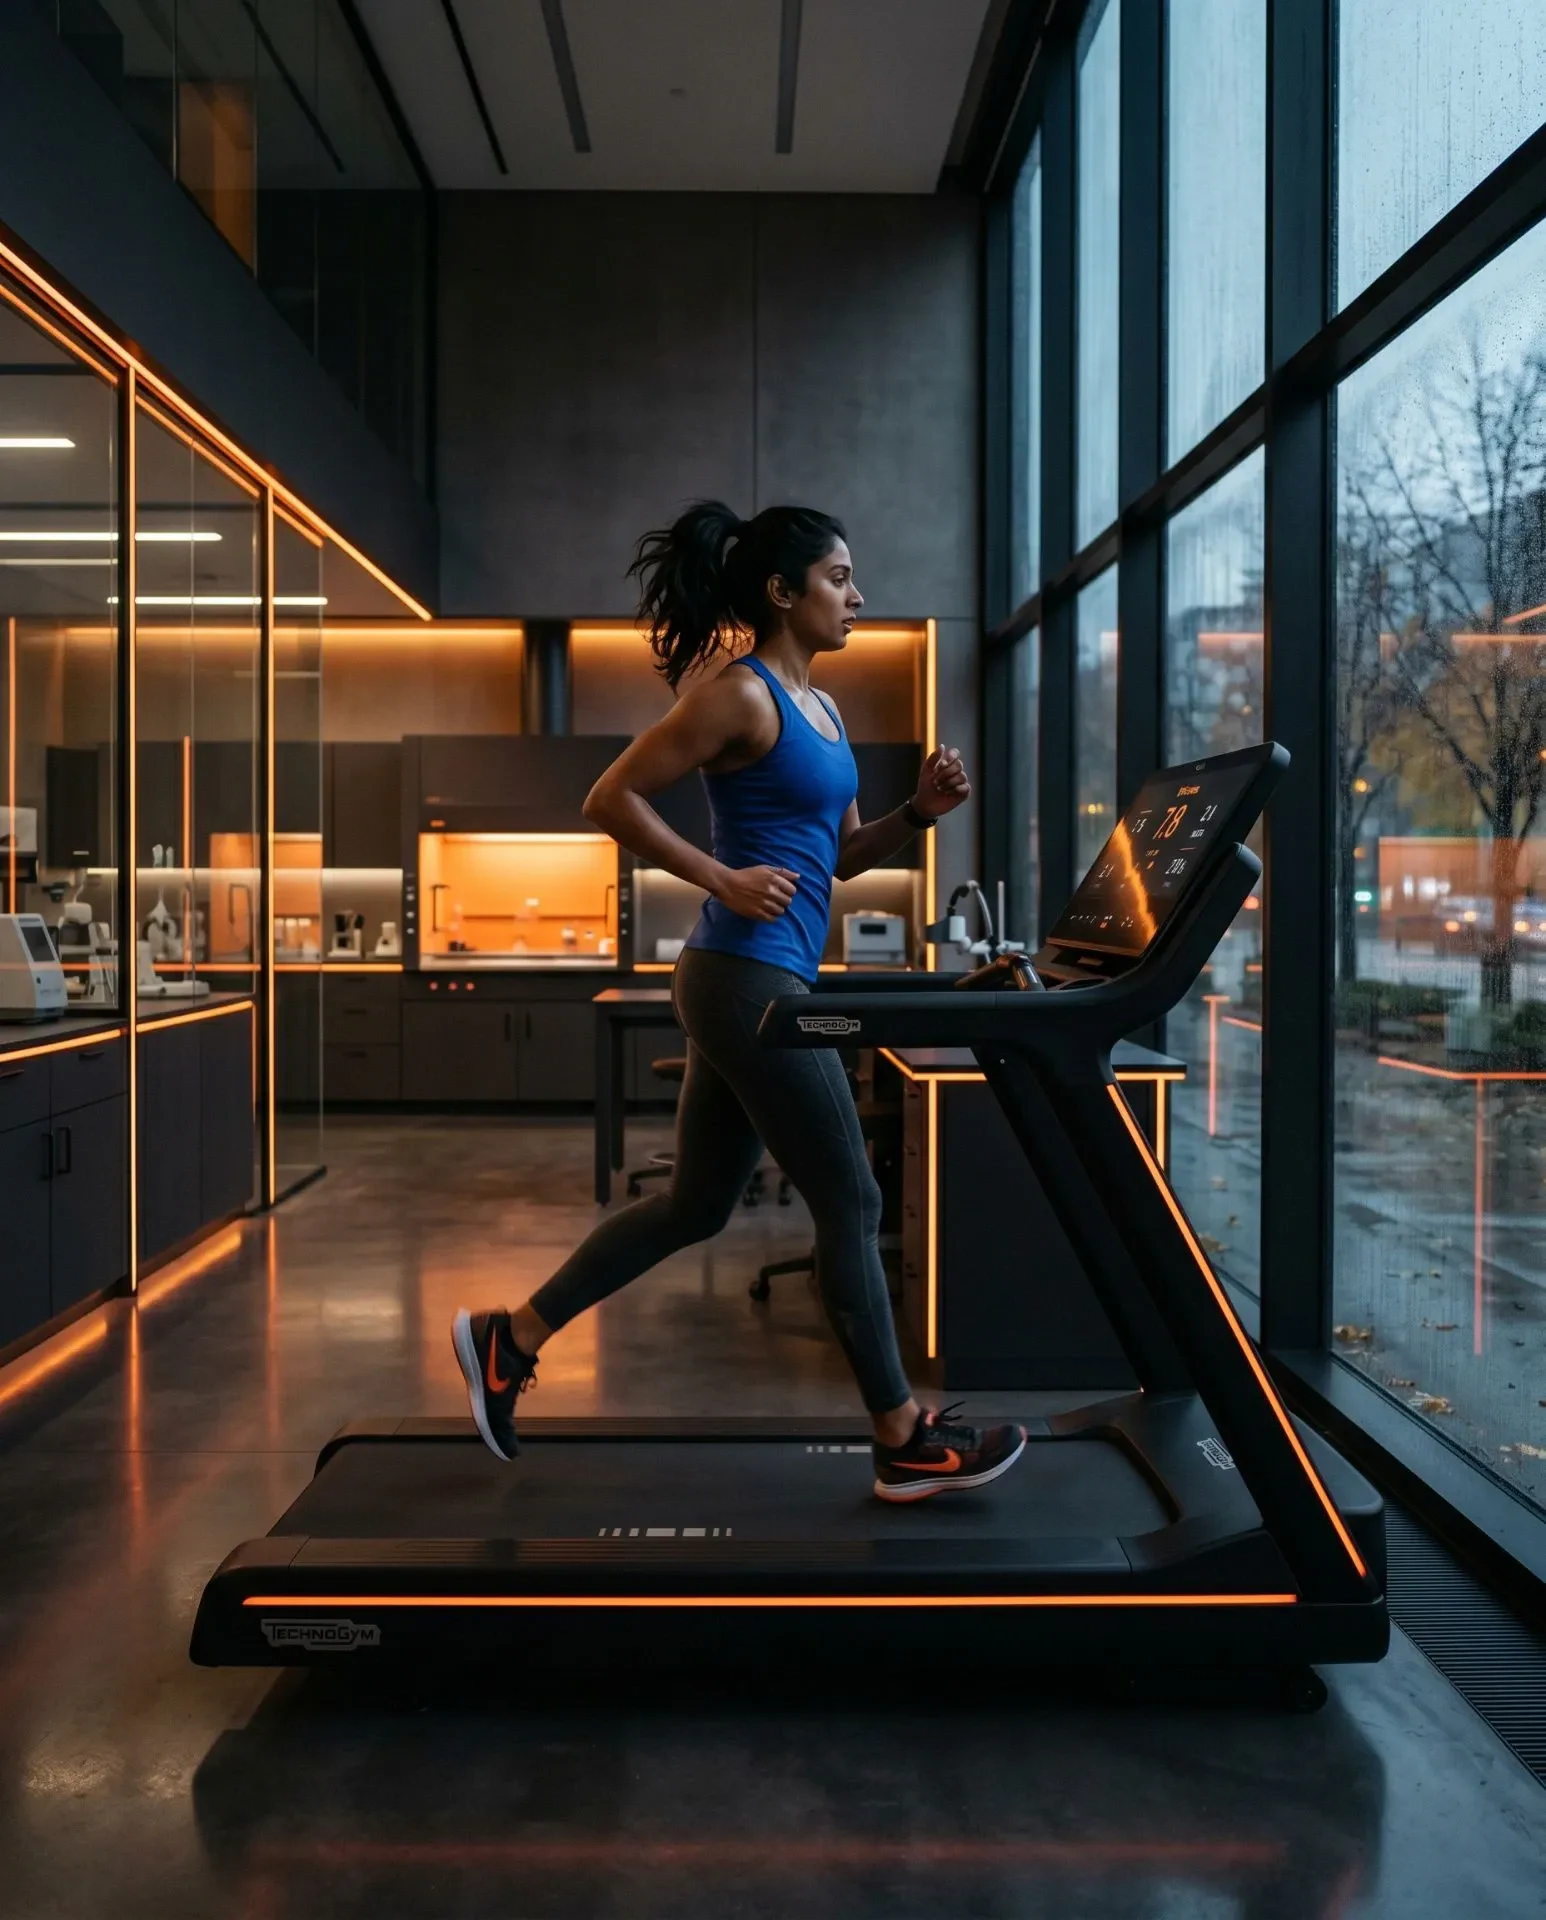
Validated wearable sensors designed for long-term physiological capture, not consumer moments.
Full access to raw PPG and derived physiological signals, timestamped and exportable.
APIs and integrations built to support research pipelines, clinical systems, and AI development.
Built for IRB-approved studies, institutional deployments, and population-level programs.
Scientific Validation
Sensor Bio measurements have been independently validated against gold-standard references, including ECG chest straps and laboratory protocols. Our approach emphasizes transparency, reproducibility, and scientific rigor.
We believe trust is earned through data, not claims.
Sensor Bio captures continuous, longitudinal physiological signals and makes them available as trusted, research-grade data.
Raw data access, IRB-friendly workflows, and reproducible signal quality for academic and clinical studies.
Continuous insight infrastructure to support prevention programs and population health initiatives.
Foundational data layer powering AI, advanced analytics, and health innovation at scale.
Our Philosophy
We believe health should be inevitable, not accidental. When the truth of the human body is clearly understood, systems can act earlier, decisions become wiser, and preventable disease becomes avoidable.
Sensor Bio exists to
make that truth visible.

Join Us
Whether you're advancing research, enabling clinical programs, or building the next generation of health platforms, Sensor Bio provides the foundation you can trust.