


What wearable PPG can measure: a map of the research
Photoplethysmography (PPG) is the light sensor on the back of most wearables. This map groups 152 studies into 15 research areas, from heart rhythm and sleep to blood pressure trends and stress, with how strong each body of evidence is.
Photoplethysmography, or PPG, is the green light you see on the back of a smartwatch, ring or fitness band. It is one of the most studied signals in wearable health research. A 2022 systematic review by Almarshad and colleagues sorted the features and applications of the PPG signal across hundreds of papers 1. We took the wearable, skin-contact studies from that review, checked every reference, and built a map of what this one optical sensor has been used to study. The map shows what research has explored. It is not a list of what any one wearable measures.
If you want the basics first, start with a primer on what photoplethysmography is and how a PPG sensor works. This page is an evidence guide. It explains what the research has explored, how strong each area is, and where the limits are. It does not claim that any single device, including ours, measures every item on the map.
Explore the map
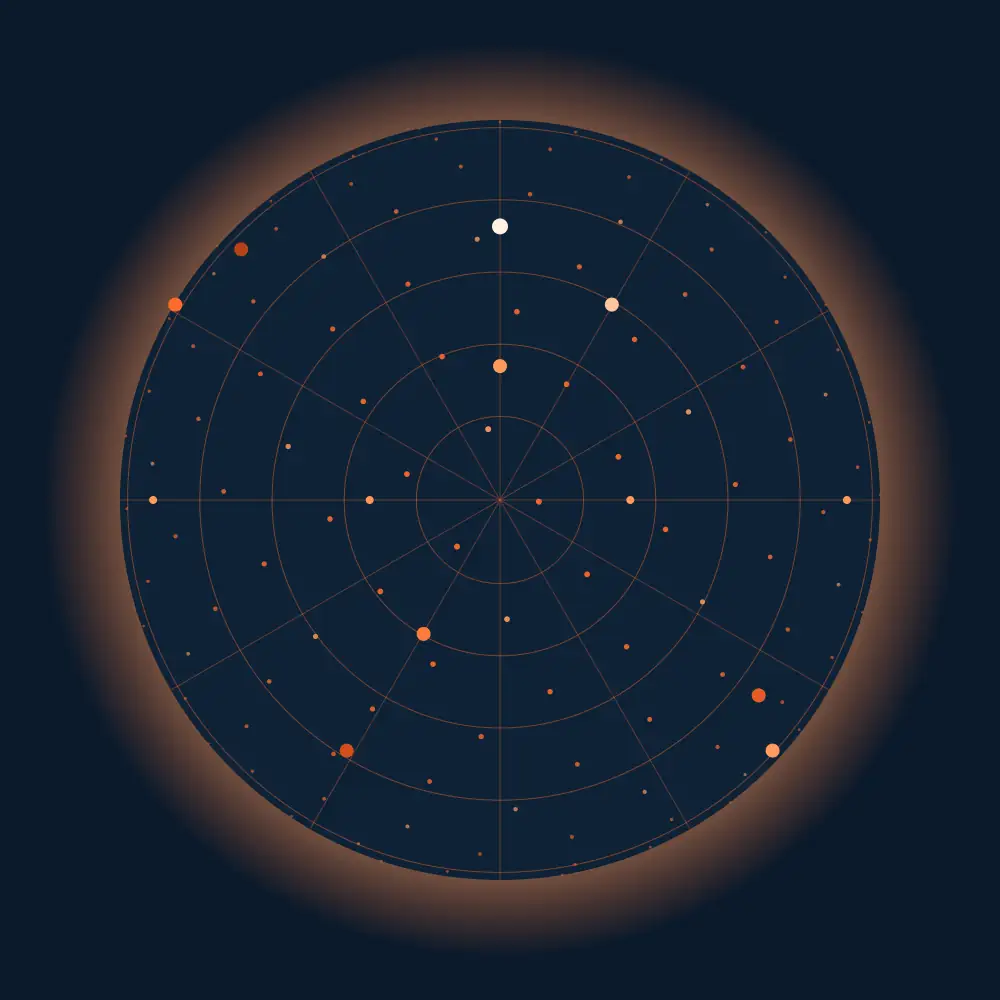
15 research areas around a 2022 systematic review of wearable, skin-contact PPG.
Research areas
Origins & physiology of PPG5 studies
Features used: Pulse morphology and dicrotic notch
Read the evidence review- Photoplethysmography Technology, Signal Analysis and Applications, 2021
- Photoplethysmography, Alian, 2014 DOI
- On the Analysis of Fingertip Photoplethysmogram Signals, Elgendi, 2012 DOI
- Photoplethysmography and its application in clinical physiological measurement, Allen, 2007 DOI
- Photoelectric Plethysmography of the Fingers and Toes in Man, Hertzman, 1937 DOI
Waveform morphology & derivatives (SDPTG/APG)3 studies
Features used: Pulse morphology and dicrotic notch
Read the evidence review- Advances in photopletysmography signal analysis for biomedical applications, Moraes, 2018 DOI
- Photoplethysmogram second derivative review: Analysis and applications, Yousef, 2015 DOI
- Independent determinants of second derivative of the finger photoplethysmogram among various cardiovascular risk factors in middle-aged men, OTSUKA, 2007 DOI
Pulse rate, PRV & autonomic function9 studies
Features used: Beat intervals
Read the evidence review- Is heart rate a confounding factor for photoplethysmography markers? A systematic review, Md Lazin Md Lazim, 2020 DOI
- EEG-brain activity monitoring and predictive analysis of signals using artificial neural networks, Aileni, 2020 DOI
- Feasibility of a new free mobility procedure to evaluate the function of the autonomic nervous system in patients with syncope, Nader-Kawachi, 2020 DOI
- Estimation of heart rate and respiratory rate from ppg signal using complementary ensemble empirical mode decomposition with both independent component analysis and non-negative matrix factorization, Lei, 2020 DOI
- Photoplethysmographic Time-Domain Heart Rate Measurement Algorithm for Resource-Constrained Wearable Devices and its Implementation, Wójcikowski, 2020 DOI
- Using photoplethysmography data to estimate heart rate variability and its association with organ dysfunction in pediatric oncology patients, Mayampurath, 2018 DOI
- Real-time estimation of respiratory rate from a photoplethysmogram using an adaptive lattice notch filter, Park, 2014 DOI
- The examination of the acute vascular changes due to smoking using second derivative of photoplethysmogram, Lee, 2010 DOI
- Heart rate variability measurement using the second derivative photoplethysmogram, 2010 DOI
SpO2, perfusion & microcirculation2 studies
Features used: Red/IR ratio, Amplitude and perfusion
Read the evidence reviewBlood pressure (cuffless)25 studies
Features used: Beat intervals, Pulse morphology and dicrotic notch
Read the evidence review- PPG2ABP: Translating Photoplethysmogram (PPG) Signals to Arterial Blood Pressure (ABP) Waveforms using Fully Convolutional Neural Networks, Ibtehaz, 2022 DOI
- Towards accurate estimation of cuffless and continuous blood pressure using multi-order derivative and multivariate photoplethysmogram features, Lin, 2021 DOI
- Mathematical modeling of the cardiovascular autonomic control in healthy subjects during a passive head-up tilt test, Ishbulatov, 2020 DOI
- PP-Net: A Deep Learning Framework for PPG based Blood Pressure and Heart Rate Estimation, Panwar, 2020 DOI
- Cuffless Single-Site Photoplethysmography for Blood Pressure Monitoring, Hosanee, 2020 DOI
- Blood pressure estimation algorithm based on photoplethysmography pulse analyses, Kim, 2020 DOI
- Genetic deep convolutional autoencoder applied for generative continuous arterial blood pressure via photoplethysmography, Sadrawi, 2020 DOI
- Continuous Blood Pressure Estimation From Electrocardiogram and Photoplethysmogram During Arrhythmias, Liu, 2020 DOI
- Comparing blood pressure measurements between a photoplethysmography-based and a standard cuff-based manometry device, Nachman, 2020 DOI
- Blood Pressure Estimation Using On-body Continuous Wave Radar and Photoplethysmogram in Various Posture and Exercise Conditions, Pour Ebrahim, 2019 DOI
- The use of photoplethysmography for assessing hypertension, Elgendi, 2019 DOI
- A newwearable device for blood pressure estimation using photoplethysmogram, Lazazzera, 2019 DOI
- An Unobtrusive and Calibration-free Blood Pressure Estimation Method using Photoplethysmography and Biometrics, Xing, 2019 DOI
- Pervasive blood pressure monitoring using Photoplethysmogram (PPG) sensor, Riaz, 2019 DOI
- The Potential of Wearable Limb Ballistocardiogram in Blood Pressure Monitoring via Pulse Transit Time, Yousefian, 2019 DOI
- Impact of slow breathing on the blood pressure and subarachnoid space width oscillations in humans, Nuckowska, 2019 DOI
- Can photoplethysmography replace arterial blood pressure in the assessment of blood pressure?, Martínez, 2018 DOI
- Feasibility study for the non-invasive blood pressure estimation based on ppg morphology: Normotensive subject study, Shin, 2017 DOI
- Pulse Transit Time Based Continuous Cuffless Blood Pressure Estimation: A New Extension and A Comprehensive Evaluation, Ding, 2017 DOI
- Estimation of blood pressure variability during orthostatic test using instantaneous photoplethysmogram frequency and pulse arrival time, Rapalis, 2017 DOI
- Continuous Blood Pressure Measurement From Invasive to Unobtrusive: Celebration of 200th Birth Anniversary of Carl Ludwig, Ding, 2016 DOI
- Weighing Scale-Based Pulse Transit Time is a Superior Marker of Blood Pressure than Conventional Pulse Arrival Time, Martin, 2016 DOI
- Pulse Arrival Time Based Cuff-Less and 24-H Wearable Blood Pressure Monitoring and its Diagnostic Value in Hypertension, Zheng, 2016 DOI
- Assessment of cardiovascular function from multi-Gaussian fitting of a finger photoplethysmogram, Couceiro, 2015 DOI
- Increased arterial vascular tone during the night in patients with essential hypertension, Scholze, 2006 DOI
Respiration3 studies
Features used: Beat intervals, Amplitude and perfusion
Read the evidence review- Extracting instantaneous respiratory rate from multiple photoplethysmogram respiratory-induced variations, Dehkordi, 2018 DOI
- Extraction of respiratory signals from the electrocardiogram and photoplethysmogram: Technical and physiological determinants, Charlton, 2017 DOI
- An assessment of algorithms to estimate respiratory rate from the electrocardiogram and photoplethysmogram, Charlton, 2016 DOI
Arterial stiffness & vascular aging18 studies
Features used: Pulse morphology and dicrotic notch
Read the evidence review- Convolutional neural network model for Augmentation Index prediction based on photoplethysmography, Perpetuini, 2021 DOI
- A Comparative Study of Brachial-Ankle Pulse Wave Velocity and Heart-Finger Pulse Wave Velocity in Korean Adults, Cho, 2020 DOI
- Photoplethysmographic prediction of the ankle-brachial pressure index through a machine learning approach, Perpetuini, 2020 DOI
- Genome-wide association study identifies loci for arterial stiffness index in 127,121 UK Biobank participants, Fung, 2019 DOI
- Association of the second derivative of photoplethysmogram with age, hemodynamic, autonomic, adiposity, and emotional factors, Park, 2019 DOI
- Multi-site photoplethysmographic and electrocardiographic system for arterial stiffness and cardiovascular status assessment, Perpetuini, 2019 DOI
- Data-driven assessment of cardiovascular ageing through multisite photoplethysmography and electrocardiography, Chiarelli, 2019 DOI
- Relation between Arterial Stiffness and Markers of Inflammation and Hemostasis: Data from the Population-based Gutenberg Health Study, Arnold, 2017 DOI
- Digital Photoplethysmography for Assessment of Arterial Stiffness: Repeatability and Comparison with Applanation Tonometry, von Wowern, 2015 DOI
- Quantification the effect of ageing on characteristics of the photoplethysmogram using an optimized windkessel model, 2014 PubMed
- Photoplethysmographic signal waveform index for detection of increased arterial stiffness, Pilt, 2014 DOI
- Comparison of photoplethysmographic and arterial tonometry-derived indices of arterial stiffness, Clarenbach, 2011 DOI
- Arterial stiffness indices in healthy volunteers using non-invasive digital photoplethysmography, Brillante, 2008 DOI
- Analysis of the effect of ageing on rising edge characteristics of the photoplethysmogram using a modified windkessel model, Zahedi, 2007 DOI
- Post-challenge hyperglycaemia is an independent risk factor for arterial stiffness in Japanese men, Ohshita, 2004 DOI
- Age-related changes in peripheral pulse timing characteristics at the ears, fingers and toes, Allen, 2002 DOI
- Assessment of Vasoactive Agents and Vascular Aging by the Second Derivative of Photoplethysmogram Waveform, Takazawa, 1998 DOI
- Feasibility of monitoring vascular ageing by multi-site photoplethysmography
Heart rhythm & cardiovascular disease (incl. AFib)22 studies
Features used: Beat intervals
Read the evidence review- Fuzzy-Inspired Photoplethysmography Signal Classification with Bio-Inspired Optimization for Analyzing Cardiovascular Disorders, Prabhakar, 2020 DOI
- HRS/EHRA/APHRS/LAHRS/ACC/AHA Worldwide Practice Update for Telehealth and Arrhythmia Monitoring During and After a Pandemic, Varma, 2020 DOI
- Population-Based Screening or Targeted Screening Based on Initial Clinical Risk Assessment for Atrial Fibrillation: A Report from the Huawei Heart Study, Guo, 2020 DOI
- Reliable detection of atrial fibrillation with a medical wearable during inpatient conditions, Jacobsen, 2020 DOI
- Multi-task deep learning for cardiac rhythm detection in wearable devices, Torres-Soto, 2020 DOI
- On performance and perceived effort in trail runners using sensor control to generate biosynchronous music, Williams, 2020 DOI
- Photoplethysmography based atrial fibrillation detection: A review, Pereira, 2020 DOI
- Extracting the Jugular Venous Pulse from Anterior Neck Contact Photoplethysmography, García-López, 2020 DOI
- Analysis of relevant features from photoplethysmographic signals for atrial fibrillation classification, Millán, 2020 DOI
- A prototype photoplethysmography electronic device that distinguishes congestive heart failure from healthy individuals by applying natural time analysis, Baldoumas, 2019 DOI
- Machine learning detection of obstructive hypertrophic cardiomyopathy using a wearable biosensor, Green, 2019 DOI
- Atrial Fibrillation Detection from Wrist Photoplethysmography Signals Using Smartwatches, Bashar, 2019 DOI
- Comparison between electrocardiogram- and photoplethysmogram-derived features for atrial fibrillation detection in free-living conditions, Eerikäinen, 2018 DOI
- Identification of Atrial Fibrillation by Quantitative Analyses of Fingertip Photoplethysmogram, Tang, 2017 DOI
- Modeling of the photoplethysmogram during atrial fibrillation, Sološenko, 2017 DOI
- Second derivative of the finger photoplethysmogram and cardiovascular mortality in middle-aged and elderly Japanese women, Inoue, 2016 DOI
- The time is ripe to reevaluate the second derivative of the digital photoplethysmogram (SDPTG), originating in Japan, as an important tool for cardiovascular risk and central hemodynamic assessment, Miyashita, 2016 DOI
- Factor structure of indices of the second derivative of the finger photoplethysmogram with metabolic components and other cardiovascular risk indicators, Kawada, 2013 DOI
- The non-invasive and continuous estimation of cardiac output using a photoplethysmogram and electrocardiogram during incremental exercise, Wang, 2010 DOI
- Comparison of arterial functional evaluations as a predictor of cardiovascular events in hypertensive patients: The non-invasive atherosclerotic evaluation in hypertension (NOAH) study, TERAI, 2008 DOI
- Calibrated photoplethysmographic estimation of digital pulse volume and arterial compliance, Raamat, 2007 DOI
- Cardiovascular effects of continuous positive airway pressure in patients with heart failure and obstructive sleep apnea, Kaneko, 2003 DOI
Sleep & sleep-disordered breathing5 studies
Features used: Beat intervals, Amplitude and perfusion
Read the evidence review- Detection and Classification of Sleep Apnea and Hypopnea Using PPG and SpO2 Signals, Lazazzera, 2021 DOI
- Deep learning enables sleep staging from photoplethysmogram for patients with suspected sleep apnea, Korkalainen, 2020 DOI
- Wearable monitoring of sleep-disordered breathing: Estimation of the apnea-hypopnea index using wrist-worn reflective photoplethysmography, Papini, 2020 DOI
- Comparison between blood pressure during obstructive respiratory events in REM and NREM sleep using pulse transit time, Almeneessier, 2020 DOI
- Detection of respiratory arousals using photoplethysmography (PPG) signal in sleep apnea patients, Karmakar, 2014 DOI
Diabetes & metabolic health10 studies
Features used: Pulse morphology and dicrotic notch, Amplitude and perfusion
Read the evidence review- Percussion entropy analysis of synchronized ECG and PPG signals as a prognostic indicator for future peripheral neuropathy in type 2 diabetic subjects, Wei, 2020 DOI
- Prognosis of Diabetic Peripheral Neuropathy via Decomposed Digital Volume Pulse from the Fingertip, Wei, 2020 DOI
- A Noninvasive Glucose Monitoring SoC Based on Single Wavelength Photoplethysmography, Hina, 2020 DOI
- Digital volume pulse measured at the fingertip as an indicator of diabetic peripheral neuropathy in the aged and diabetic, Wei, 2019 DOI
- Detection of type-2 diabetes using characteristics of toe photoplethysmogram by applying support vector machine, Nirala, 2019 DOI
- Live demonstration: A single LED PPG-based noninvasive glucose monitoring prototype system, Hina, 2019 DOI
- Instantaneous frequency from Hilbert-Huang transformation of digital volume pulse as indicator of diabetes and arterial stiffness in upper-middle-aged subjects, Wei, 2018 DOI
- Increased blood glycohemoglobin A1c levels lead to overestimation of arterial oxygen saturation by pulse oximetry in patients with type 2 diabetes, Pu, 2012 DOI
- Right-left correlation of the sympathetically induced fluctuations of photoplethysmographic signal in diabetic and non-diabetic subjects, Buchs, 2005 DOI
- Photoplethysmographic assessment of pulse wave reflection: Blunted response to endothelium-dependent beta2-adrenergic vasodilation in type II diabetes mellitus, Chowienczyk, 1999 DOI
Stress, emotion & cognitive load10 studies
Features used: Beat intervals, Amplitude and perfusion
Read the evidence review- Prediction of state anxiety by machine learning applied to photoplethysmography data, Perpetuini, 2021 DOI
- Detection of drivers’ anxiety invoked by driving situations using multimodal biosignals, Lee, 2020 DOI
- Differences between young and older adults in physiological and subjective responses to emotion induction using films, Fernández-Aguilar, 2020 DOI
- Physiological sensors based emotion recognition while experiencing tactile enhanced multimedia, Raheel, 2020 DOI
- Validation of a wireless bluetooth photoplethysmography sensor used on the earlobe for monitoring heart rate variability features during a stress-inducing mental task in healthy individuals, Correia, 2020 DOI
- Stress classification using photoplethysmogram-based spatial and frequency domain images, Elzeiny, 2020 DOI
- Assessing drivers’ physiological responses using consumer grade devices, Gruden, 2019 DOI
- Assessing mental stress from the photoplethysmogram: A numerical study, Charlton, 2018 DOI
- Evaluating Photoplethysmogram as a Real-Time Cognitive Load Assessment during Game Playing, Zhang, 2018 DOI
- Evaluation of pre-operative anxiety and propofol-induced sedation using newly proposed indices of finger vascular tone, Tanaka, 2002 DOI
Clinical monitoring settings29 studies
Features used: Red/IR ratio, Amplitude and perfusion
Read the evidence review- Measuring Heart Rate Variability Using Commercially Available Devices in Healthy Children: A Validity and Reliability Study, Speer, 2020 DOI
- Skin-interfaced biosensors for advanced wireless physiological monitoring in neonatal and pediatric intensive-care units, Chung, 2020 DOI
- Low-frequency variability in photoplethysmographic waveform and heart rate during on-pump cardiac surgery with or without cardioplegia, Kiselev, 2020 DOI
- Wearable Sensors for COVID-19: A Call to Action to Harness Our Digital Infrastructure for Remote Patient Monitoring and Virtual Assessments, Seshadri, 2020 DOI
- An Evaluation of Biometric Monitoring Technologies for Vital Signs in the Era of COVID-19, Manta, 2020 DOI
- Combining Physiological and Neuroimaging Measures to Predict Affect Processing Induced by Affectively Valent Image Stimuli, Wilson, 2020 DOI
- Convergence of physiological responses to pain during face-to-face interaction, Murata, 2020 DOI
- Smart sensors for real-time monitoring of patients on dialysis, Wieringa, 2020 DOI
- Performance of the nasal photoplethysmographic index as an analgesic index during surgery under general anaesthesia, Park, 2020 DOI
- In-ear spo2: A tool for wearable, unobtrusive monitoring of core blood oxygen saturation, Davies, 2020 DOI
- Markers of subclinical vascular damages associate with indices of adiposity and blood pressure in obese children, Bonafini, 2019 DOI
- Cardiorespiratory behavior of preterm infants receiving continuous positive airway pressure and high flow nasal cannula post extubation: Randomized crossover study, Kanbar, 2019 DOI
- Quantifying neurologic disease using biosensor measurements in-clinic and in free-living settings in multiple sclerosis, Chitnis, 2019 DOI
- Digital biomarkers for Alzheimer’s disease: The mobile/wearable devices opportunity, Kourtis, 2019 DOI
- Photoplethysmographic assessment of pulse transit time correlates with echocardiographic measurement of stroke volume in preterm infants with patent ductus arteriosus, Amirtharaj, 2018 DOI
- Quantitative Evaluation of Pain during Electrocutaneous Stimulation using a Log-Linearized Peripheral Arterial Viscoelastic Model, Matsubara, 2018 DOI
- Bilateral photoplethysmography for arterial steal detection in arteriovenous fistula using a fractional-order decision-making quantizer, Wu, 2016 DOI
- On time domain analysis of photoplethysmogram signals for monitoring heat stress, Elgendi, 2015 DOI
- Monitoring Technologies in Acute Care Environments, 2015
- Pulse transit time as a quick predictor of a successful axillary brachial plexus block, KORTEKAAS, 2012 DOI
- Is respiration-induced variation in the photoplethysmogram associated with major hypovolemia in patients with acute traumatic injuries?, Chen, 2010 DOI
- Photoplethysmography and nociception: Review Article, KORHONEN, 2009 DOI
- Feasibility of noninvasive continuous finger arterial blood pressure measurements in very young children, aged 0-4 years, Andriessen, 2008 DOI
- VI REVIEW ARTICLE Utility of the Photoplethysmogram in Circulatory Monitoring, Reisner, 2008 DOI
- Impaired microvascular perfusion improves with increased incubator temperature in preterm infants, Genzel-Boroviczény, 2007 DOI
- Pulse transit time as a derived noninvasive mean to monitor arterial distensibility changes in children, Foo, 2005 DOI
- Hemodynamic changes in Alzheimer’s and Binswanger’s diseases as evaluated by second-derivative finger photoplethysmography, Iwamoto, 2003 DOI
- Monitoring neonatal peripheral circulation by electrocardiogram-to-oximeter pulse velocity, Oishi, 1993 DOI
Fitness, exercise & everyday health3 studies
Features used: Beat intervals, Amplitude and perfusion
Read the evidence review- Pulse Rate Measurement during Sleep Using Wearable Sensors, and its Correlation with the Menstrual Cycle Phases, A Prospective Observational Study, Shilaih, 2017 DOI
- Usefulness of the second derivative of the finger photoplethysmogram for assessment of end-organ damage: The J-SHIPP study, Tabara, 2016 DOI
- Analysis of the changes in photoplethysmogram induced by exercise stress, Li, 2013 DOI
Datasets & methods6 studies
Features used: Beat intervals, Pulse morphology and dicrotic notch
Read the evidence review- K-EmoCon, a multimodal sensor dataset for continuous emotion recognition in naturalistic conversations, Park, 2020 DOI
- Van Deep PPG: Large-scale Heart Rate Estimation with Convolutional Neural Networks, Reiss, 2019 DOI
- MIMIC-III, a freely accessible critical care database, Johnson, 2016 DOI
- TROIKA: A general framework for heart rate monitoring using wrist-type photoplethysmographic signals during intensive physical exercise, Zhang, 2015 DOI
- University of Queensland vital signs dataset: Development of an accessible repository of anesthesia patient monitoring data for research, Liu, 2012 DOI
- CapnoBase: Signal database and tools to collect, share and annotate respiratory signals
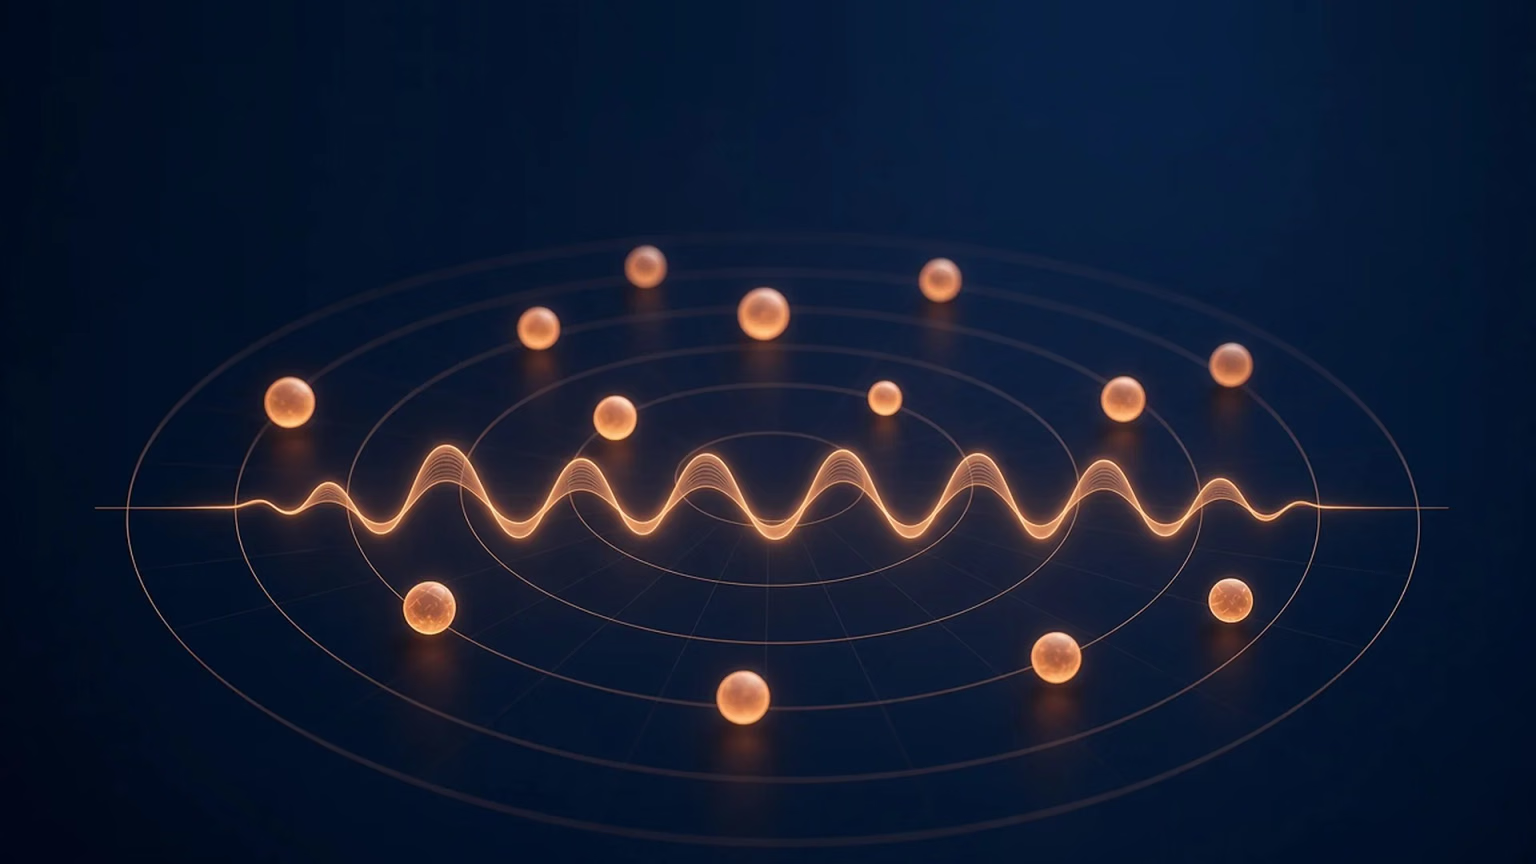
How to read it. The globe turns slowly on its own. Each glowing cluster is one of the 15 research areas, and the small dots around it are the studies in that area, sized by how often they have been cited. The pulse line around the middle is a PPG waveform. Hover an area to see how many studies it holds and which waveform features they use. Click an area to turn the globe toward it, see its key studies with DOI links, and open its evidence review where one is published. Drag to turn the globe yourself. On phones, or if your device asks for reduced motion, the map is a still image with the same links. Every area and study is also listed as plain text below the map.
The evidence at a glance
The table below lists the 15 research areas on the map, how many wearable studies from the review fall in each (as the main topic, then counting studies that touch it), and our plain reading of how mature that evidence is. "Strong" means large studies or repeated validation against a reference method. "Emerging" means promising but mostly small or lab-based. "Early" means few studies, small samples, or results that have not held up outside the lab.
| Research area | Studies (main / any) | Evidence reading | Where to go next |
|---|---|---|---|
| Origins and physiology | 5 / 6 | Background science | How wearable PPG works |
| Sensors, wavelengths, body sites | 3 / 3 | Background science | PPG for wearable products |
| Waveform shape and derivatives | 3 / 18 | Established methods | PPG signal quality |
| Pulse rate, HRV, autonomic | 9 / 17 | Strong at rest, weaker in motion | Continuous HRV in research |
| Blood oxygen and perfusion | 2 / 5 | Established in clinic, known bias | SpO2 monitoring |
| Blood pressure | 25 / 25 | Many studies, calibration needed | Wearable blood pressure research |
| Breathing rate | 3 / 6 | Emerging, method dependent | Breathing in sleep research |
| Arterial stiffness, vascular aging | 18 / 19 | Emerging, mostly finger | Vascular aging research |
| Heart rhythm and AF | 22 / 22 | Strong, confirmed by ECG | AF screening with wearables |
| Sleep and breathing in sleep | 5 / 6 | Emerging | Wearable sleep apnea research |
| Diabetes and metabolic health | 10 / 10 | Early; not a glucose reading | Can a watch measure glucose? |
| Stress, emotion, cognitive load | 10 / 11 | Early, mostly lab protocols | How wearables measure stress |
| Clinical settings | 29 / 33 | Established in hospital monitoring | Remote patient monitoring |
| Fitness and everyday health | 3 / 5 | Emerging | Heart rate recovery research |
| Datasets and methods | 6 / 6 | Research infrastructure | Raw PPG access |
Each research area links to its own evidence review or to the closest existing guide. Background areas link to the matching section of this page.
How wearable PPG works
PPG was first described as photoelectric plethysmography of the fingers and toes in 1937 3. The idea has not changed much. A light source shines into the skin, a photodetector measures the light that comes back, and the amount changes slightly with every heartbeat as blood volume in the small vessels rises and falls 2.
The signal has two parts. A large, slowly changing part reflects tissue, bone and the average amount of blood. A small pulsing part, often under a few percent of the total, follows the heartbeat 2. Almost everything on the map is extracted from that small pulsing part and how it changes over time. For how these signals are measured, see the science of PPG.
Reflectance and transmission
A fingertip clip in a hospital shines light through the finger to a detector on the other side. That is transmission PPG. Wrist devices and rings place the light and the detector side by side and read light scattered back toward the skin. That is reflectance PPG, and it is what most wearables use 4. Much of the classic research in this map used the finger, so results do not always carry over to the wrist without new validation.
Green, red and infrared
Wavelength matters. Green light is absorbed strongly by blood and stays near the surface, which gives a clean pulse at the wrist. Red and infrared light travel deeper. The ratio of how red and infrared light are absorbed is the principle behind pulse oximetry and blood oxygen estimates 412.
Where it sits on the body
The map's body site nodes cover the finger, wrist, ear, toe, forehead and more. Finger studies dominate the source review. Wrist studies are fewer, and the review has no ring or chest patch studies, so those form factors need newer evidence than this map covers.
Camera-based (remote) PPG reads the same pulse from video without skin contact. It is a separate topic and not covered here.
Why raw waveforms matter, using our sensor as an example
Many research uses on this map need the full waveform. A heart rate number alone is not enough. Pulse shape, the second derivative and beat-to-beat timing are all calculated from raw samples. As one example, Sensor Bio V2 stores raw green, red and infrared PPG at 25, 50 or 100 Hz, and partner teams can pull those waveforms through the mobile SDK raw stream or a per-organization download. Processing happens in the Sensor Bio cloud on AWS, which checks signal quality and motion before beat detection, then derives metrics such as heart rate, heart rate variability and respiratory rate. Teams read those metrics through the REST API. V2 is a general wellness device and is not FDA cleared. It appears here to show what raw multi-wavelength capture looks like, not to claim it measures every area on the map.
How raw PPG access worksFor the product view of the sensor, including wavelengths and signal quality, see PPG for wearable products.
Reading the waveform
How these signals are measured: the science of PPG.
A single PPG pulse has a steep rise, a systolic peak, a small dip often called the dicrotic notch, and a smaller diastolic wave. Researchers describe these features in detail, and fingertip studies show how they shift with age and vascular tone 5.
Dicrotic notch
The dicrotic notch is the small dip after the main peak. In the pressure wave it is linked with closure of the aortic valve and with reflected waves returning from the smaller arteries. By the time the pulse reaches a fingertip or wrist, the notch is often blurred, and in older adults or in people with stiffer arteries it can flatten out entirely 25.
That is why the notch shows up in research mainly as a waveform feature, not as a measurement on its own. Studies use its timing and depth, together with the diastolic wave that follows, to describe how strongly the pulse is reflected. Early work in this area found that the PPG reflection response changed with drugs that act on blood vessels and was blunted in people with diabetes 24. A later study built a waveform index from contour features to separate people with and without increased arterial stiffness 42.
Two cautions apply. First, most notch studies used finger PPG under still, controlled conditions, and wrist signals are noisier. Second, the notch is easy to miss or mislabel when the signal is weak, so beat detection and quality checks matter before any feature is trusted. For the physiology in more depth, see this dicrotic notch explainer.
Perfusion index
The perfusion index compares the pulsing part of the PPG signal with the steady part, usually as a percentage. A higher value means a stronger pulse signal at that site. It depends on local blood flow, so it changes with temperature, vessel tone, posture and how firmly the sensor sits on the skin 2.
In hospital research, the perfusion index has been studied as a noninvasive window on peripheral circulation, for example in critically ill patients where poor skin perfusion can reflect wider circulatory problems 40. PPG has also been studied for circulatory monitoring during anesthesia, where changes in pulse amplitude track changes in vessel tone 29.
For wearables, the perfusion index is most useful as a signal quality guide. A low value at the wrist on a cold morning tells a researcher that pulse features from that period deserve less weight. Research shows it is a property of the signal at one site, not a whole body measure, and it is not a stand in for blood pressure or cardiac output. A plain language perfusion index explainer covers the definition in more detail.
The second derivative
The second derivative of the waveform, sometimes called the acceleration plethysmogram, turns subtle curves into clear peaks labelled a through e. In 1998, Takazawa and colleagues showed that an index built from those peaks tracked age and the effect of drugs that relax or tighten blood vessels 6. A later review covers the wider set of signal analysis methods used in biomedical PPG research 36.
None of this works on a noisy signal. Signal quality checks and beat detection come first. See PPG signal quality and PPG beat detection algorithms for how teams handle it.
What PPG measures day to day: the core signals
Pulse rate, pulse rate variability and the autonomic nervous system
The most established use of wearable PPG is pulse rate. Variation in the time between beats, called pulse rate variability, is used as a stand-in for heart rate variability (HRV), which reflects the balance of the autonomic nervous system. A review comparing PPG with ECG found pulse rate variability is a good estimate of HRV mainly at rest and in healthy people, with more error during movement and some conditions 10. Newer device-level work points the same way. A 2021 validation of a wrist-worn PPG band found acceptable agreement with ECG for heart rate, while the error in HRV approached or exceeded the smallest change that would matter in practice 11. In other words, average pulse rate is the easier target, and beat-to-beat timing needs more care. A study in healthy children also tested commercially available devices for HRV 37.
For how research teams use these signals, see how researchers use continuous HRV and what vagal tone means.
Blood oxygen and perfusion
Red and infrared PPG are the basis of pulse oximetry 12. Pulse oximeters are widely used and have known limits. In a study of hospital patients, low arterial oxygen that the pulse oximeter missed was found almost three times as often in Black patients as in White patients (11.7% vs 3.6%) 13. That finding applies to oxygen saturation estimates, and it is a reason any wearable oxygen metric needs validation across skin tones. See SpO2 monitoring, is SpO2 accurate at night and PPG skin tone validation.
Breathing rate
Breathing changes the PPG signal in three ways: the baseline drifts, the pulse height changes, and the pulse rate speeds up and slows with each breath. An assessment of many algorithms found that respiratory rate can be estimated from PPG and ECG, with large differences in performance between methods 7. Later work on pulse oximeter signals aimed to make those estimates hold up better in practice 38. A technical review of respiratory signal extraction from ECG and PPG set out where the methods work and where they still struggle, especially outside the hospital 48, and newer methods combine all three breathing effects to estimate breathing rate from moment to moment 55.
Vascular health and blood pressure trends
Arterial stiffness and vascular aging
As arteries stiffen with age, the pulse wave travels faster and reflections arrive earlier, which changes the PPG shape. This is one of the largest research areas in the map. Digital PPG has been studied for arterial stiffness with repeatability testing against established reference methods 14, and the second-derivative work above was among the first to link PPG shape with vascular aging 6.
Pulse wave velocity
Pulse wave velocity is how fast the pressure wave travels along the arteries. Stiffer arteries carry it faster, so pulse wave velocity is widely used in research as a marker of arterial stiffness. The reference methods use pressure sensors or cuffs at two points on the body, such as the neck and the groin.
PPG can approach the same idea in two ways. The first is timing. Measuring when the pulse arrives at different sites, such as the ear, finger and toe, shows that pulse timing changes with age 41. Pairing a PPG sensor with an ECG gives the pulse arrival time, and with two PPG sites gives a pulse transit time between them 16. The second is shape. Because faster waves bring reflections back sooner, features of a single pulse, especially from the second derivative, change with arterial stiffness and with cardiovascular risk factors 643.
The research reading is clear. Finger and multi-site studies show PPG features relate to arterial stiffness, and digital PPG has been compared with applanation tonometry for repeatability 14. A single wrist sensor sees only one site, so it relies on shape or on pairing with another signal. Results from wrist devices need their own validation before they can be compared with reference pulse wave velocity. For a definition with diagrams, see what pulse wave velocity is.
For the full evidence review on blood pressure trends and vascular aging, see wearable blood pressure research.
Blood pressure, and why trends differ from readings
Blood pressure is the largest single cluster on the map. Methods use pulse transit time (how long the pulse takes to travel between two points) or the PPG shape itself, increasingly with machine learning 151617. Reviews are consistent on the caveats: most methods need calibration against a cuff, accuracy can drift, and validation standards apply to cuffless devices 1516. For wearables, that means research supports blood pressure trends as an education topic. It does not support reading a number off a wrist sensor as a substitute for a validated cuff.
Smartwatch blood pressure: what the research shows about trends
Smartwatch blood pressure features are where the gap between research and everyday expectations is widest. Three findings from the literature explain most of it.
Calibration. Pulse transit time methods relate timing to pressure through the stiffness of the artery, and that relation differs between people. Most methods therefore start from a cuff reading and track change from there. A comprehensive evaluation of pulse transit time methods showed that how well estimates hold up depends on the model and on how often the device is recalibrated 45.
Drift. Vessel tone changes with temperature, posture, stress and medication, and these changes can move pulse timing without the same change in pressure. Over hours and days, estimates can drift away from cuff values 1617.
Validation. An IEEE standard sets out how wearable cuffless blood pressure devices should be tested, including testing after calibration and over time 44. Deep learning models that estimate pressure from PPG alone, such as PP Net, report promising results on research datasets 52, but dataset results are not the same as validation in daily wear.
Taken together, the research supports using wearable PPG to study blood pressure trends and vascular health as an education topic. Nothing on this page describes a Sensor Bio blood pressure reading. If you have questions about your blood pressure, a validated cuff and a clinician are the right next step. For a buyer focused guide, see this blood pressure smartwatch guide.
Heart rhythm and atrial fibrillation
Irregular pulse timing is the PPG signature of atrial fibrillation (AF). A review of PPG-based AF algorithms summarizes their methods and performance across studies 18, and wrist PPG from smartwatches has been used to flag AF in research settings 19.
Two large studies tested this at population scale. The Apple Heart Study enrolled 419,297 participants, and 0.52% received an irregular pulse notification over a median of 117 days. Among notified participants who returned an analyzable ECG patch, 34% had AF on the patch, and 84% of notifications that occurred while the patch was worn matched AF on the ECG 20. The Fitbit Heart Study enrolled 455,699 participants. Irregular rhythm detections occurred in 1% of participants. Among participants who wore an ECG patch and had another detection during that time, 221 of 225 detections matched AF on the ECG, a positive predictive value of 98.2% 21.
Those numbers answer a specific question: when the algorithm flagged an irregular rhythm during ECG monitoring, how often was AF really present. They do not show how many people with AF were missed, and they come from people who chose to join a study. Deep learning methods for rhythm classification on wearable PPG have also been developed, with signal quality assessment built in 49. In both, the notification was a prompt to confirm with ECG, not a diagnosis. For more detail, see AF screening with wearables and PPG vs ECG vs pulse oximetry.

For research teams
Put the raw signal in your study or product
Designing a study on raw PPG? We can help you plan capture, wavelengths and export.
Sleep and sleep-disordered breathing
PPG changes with sleep stage because heart rate, HRV and breathing all shift through the night. A deep learning study staged sleep from PPG in patients referred for suspected sleep apnea 22. Another study estimated the apnea-hypopnea index from wrist-worn reflective PPG 23. Combining PPG with oxygen saturation, one study classified apnea and hypopnea events 46, and another used PPG to find respiratory arousals in patients with sleep apnea 47. Results are promising for screening research, while polysomnography remains the reference. See sleep and aging.
For a full review of breathing and apnea screening research, see wearable sleep apnea research.
Metabolic, mental and everyday health
Diabetes and metabolic health
This area needs care. The studies on the map look at vascular and autonomic changes linked with diabetes, not at reading blood glucose. For example, early work found a blunted PPG pulse reflection response in people with diabetes 24, and a later study classified type 2 diabetes from toe PPG features 25. Research shows PPG has been studied for diabetes-related vascular change. It has not been shown to replace glucose testing.
Separate engineering work has tried to estimate glucose from PPG directly. One chip design paper reported glucose estimates from single wavelength PPG with machine learning 51. Results like this have not been confirmed in large independent trials, and a wearable that estimates glucose from light is not the same as a glucose meter.
For the full evidence review, see can a watch measure glucose?
Stress, emotion and cognitive load
Stress changes pulse rate and its variability, and the PPG shape. A numerical study looked at how mental stress could be assessed from PPG 26, and a scoping review of PPG wearables for stress detection found a growing but varied literature, with many lab-based protocols 27. A machine learning study predicted state anxiety scores from PPG features in a lab setting 50. Lab stress tasks do not always match daily life, so these results are best treated as early.
For the full evidence review, see how wearables measure stress.
Fitness, cycles and everyday health
PPG worn during sleep has been used to study pulse rate changes across the menstrual cycle 28. A later observational study combined wrist sensor signals to predict the fertile window 39. Exercise and recovery studies also sit in this cluster. See heart rate recovery on a wearable and recovery scores.
PPG in clinical settings
PPG has long been used in hospitals beyond oxygen saturation, including circulatory monitoring during anesthesia 29. Skin-interfaced wireless sensors have been tested in neonatal and pediatric intensive care 30. During COVID-19, researchers called for wearable sensors to support remote monitoring 31, and a smartwatch study found changes in heart rate, steps or sleep in most COVID-19 positive participants, some before symptoms began 32. A follow-up study tested real-time alerts from smartwatch heart rate in daily life 53. For how wearables fit into care programs, see remote patient monitoring and wearables for clinical trials.
Open datasets and how PPG research is done
Much of this research runs on shared datasets. MIMIC-III is a freely accessible critical care database that includes PPG waveforms 33. K-EmoCon is a multimodal dataset for emotion recognition 34, and the University of Queensland vital signs dataset was built from anesthesia monitoring 35. CapnoBase is widely used for breathing rate work, and PPG-DaLiA provides wrist PPG recorded during daily activities for heart rate research 54. See digital biomarkers and our science page.
How to judge a wearable PPG study
The map mixes very different kinds of evidence. A few questions help sort them.
- What was the reference? A study that compares PPG with ECG, polysomnography, arterial blood gas or a validated cuff tells you more than one that compares two wearables.
- Where was the sensor? Finger results do not automatically carry over to the wrist or a ring. Look for validation at the same body site.
- Was anyone moving? Many studies record at rest. Error during activity can be much higher 8.
- Who took part? Small samples of young, healthy volunteers do not represent people with different ages, skin tones or health conditions 13.
- Lab or daily life? Stress tasks, breathing protocols and controlled sleep labs are useful, but daily wear adds motion, temperature and loose fit.
- What was the question? A positive predictive value describes how often a flag was right. It does not say how many cases were missed. Accuracy on a public dataset is not the same as accuracy in daily wear.
Areas with large studies against a clear reference, such as pulse rate and irregular rhythm alerts, sit at the strong end of the map. Areas built mostly on small lab studies, such as glucose and emotion, sit at the early end.
Limits and open questions
- Motion. Movement is the largest source of error for wrist PPG, especially during activity 8. Algorithms such as TROIKA were designed to track heart rate through that motion 9.
- Skin tone and perfusion. Heart rate error did not differ significantly by skin tone in one study of consumer and research wearables 8, while oxygen saturation estimates have shown bias 13. Validation should cover both.
- Finger vs wrist vs ring. The review is dominated by finger studies. Wrist results need their own validation, and ring and chest patch evidence sits outside this map.
- Calibration and regulation. Blood pressure and other derived estimates need calibration and must meet validation standards before any clinical use 16.
Sources and methodology
The map starts from the reference list of Almarshad et al. 2022, a systematic review of PPG diagnostic features and applications published under a CC BY 4.0 license 1. We kept only wearable, skin-contact studies and excluded camera-based methods. We checked each DOI against Crossref and used the Crossref first author and publication year. Study sizes on the map use OpenAlex citation counts as of October 29, 2026. The map covers studies from 1937 through 2022. One study from the review, a 2020 diabetes classification paper, was later retracted, so we removed it from the map and its counts. Newer studies cited in the text are listed below.
- Almarshad MA, Islam MS, Al-Ahmadi S, BaHammam AS. Diagnostic features and potential applications of PPG signal in healthcare: a systematic review. Healthcare. 2022;10(3):547. doi:10.3390/healthcare10030547 Source
- Allen J. Photoplethysmography and its application in clinical physiological measurement. Physiol Meas. 2007;28(3):R1-R39. doi:10.1088/0967-3334/28/3/r01 Source
- Hertzman AB. Photoelectric plethysmography of the fingers and toes in man. Proc Soc Exp Biol Med. 1937. doi:10.3181/00379727-37-9630 Source
- Tamura T, et al. Wearable photoplethysmographic sensors: past and present. Electronics. 2014;3(2):282-302. doi:10.3390/electronics3020282 Source
- Elgendi M. On the analysis of fingertip photoplethysmogram signals. Curr Cardiol Rev. 2012. doi:10.2174/157340312801215782 Source
- Takazawa K, et al. Assessment of vasoactive agents and vascular aging by the second derivative of photoplethysmogram waveform. Hypertension. 1998. doi:10.1161/01.hyp.32.2.365 Source
- Charlton PH, et al. An assessment of algorithms to estimate respiratory rate from the electrocardiogram and photoplethysmogram. Physiol Meas. 2016. doi:10.1088/0967-3334/37/4/610 Source
- Bent B, et al. Investigating sources of inaccuracy in wearable optical heart rate sensors. NPJ Digit Med. 2020. doi:10.1038/s41746-020-0226-6 Source
- Zhang Z, et al. TROIKA: a general framework for heart rate monitoring using wrist-type photoplethysmographic signals. IEEE Trans Biomed Eng. 2015. doi:10.1109/tbme.2014.2359372 Source
- Schäfer A, Vagedes J. How accurate is pulse rate variability as an estimate of heart rate variability? Int J Cardiol. 2013. doi:10.1016/j.ijcard.2012.03.119 Source
- Bellenger CR, et al. Wrist-based photoplethysmography assessment of heart rate and heart rate variability: validation of WHOOP. Sensors. 2021. doi:10.3390/s21103571 Source
- DeMeulenaere S. Pulse oximetry: uses and limitations. J Nurse Pract. 2007. doi:10.1016/j.nurpra.2007.02.021 Source
- Sjoding MW, et al. Racial bias in pulse oximetry measurement. N Engl J Med. 2020. doi:10.1056/NEJMc2029240 Source
- von Wowern E, et al. Digital photoplethysmography for assessment of arterial stiffness: repeatability and comparison with applanation tonometry. PLoS One. 2015. doi:10.1371/journal.pone.0135659 Source
- Elgendi M, et al. The use of photoplethysmography for assessing hypertension. NPJ Digit Med. 2019. doi:10.1038/s41746-019-0136-7 Source
- Mukkamala R, et al. Toward ubiquitous blood pressure monitoring via pulse transit time: theory and practice. IEEE Trans Biomed Eng. 2015. doi:10.1109/TBME.2015.2441951 Source
- Ding X, et al. Continuous blood pressure measurement from invasive to unobtrusive. IEEE J Biomed Health Inform. 2016. doi:10.1109/jbhi.2016.2620995 Source
- Pereira T, et al. Photoplethysmography based atrial fibrillation detection: a review. NPJ Digit Med. 2020. doi:10.1038/s41746-019-0207-9 Source
- Bashar SK, et al. Atrial fibrillation detection from wrist photoplethysmography signals using smartwatches. Sci Rep. 2019. doi:10.1038/s41598-019-49092-2 Source
- Perez MV, et al. Large-scale assessment of a smartwatch to identify atrial fibrillation. N Engl J Med. 2019. doi:10.1056/NEJMoa1901183 Source
- Lubitz SA, et al. Detection of atrial fibrillation in a large population using wearable devices: the Fitbit Heart Study. Circulation. 2022. doi:10.1161/CIRCULATIONAHA.122.060291 Source
- Korkalainen H, et al. Deep learning enables sleep staging from photoplethysmogram for patients with suspected sleep apnea. Sleep. 2020. doi:10.1093/sleep/zsaa098 Source
- Papini GB, et al. Wearable monitoring of sleep-disordered breathing: estimation of the apnea-hypopnea index using wrist-worn reflective photoplethysmography. Sci Rep. 2020. doi:10.1038/s41598-020-69935-7 Source
- Chowienczyk PJ, et al. Photoplethysmographic assessment of pulse wave reflection. J Am Coll Cardiol. 1999. doi:10.1016/s0735-1097(99)00441-6 Source
- Nirala N, et al. Detection of type-2 diabetes using characteristics of toe photoplethysmogram by applying support vector machine. Biocybern Biomed Eng. 2019. doi:10.1016/j.bbe.2018.09.007 Source
- Charlton PH, et al. Assessing mental stress from the photoplethysmogram: a numerical study. Physiol Meas. 2018. doi:10.1088/1361-6579/aabe6a Source
- Namvari M, et al. Photoplethysmography enabled wearable devices and stress detection: a scoping review. J Pers Med. 2022. doi:10.3390/jpm12111792 Source
- Shilaih M, et al. Pulse rate measurement during sleep using wearable sensors, and its correlation with the menstrual cycle phases. Sci Rep. 2017. doi:10.1038/s41598-017-01433-9 Source
- Reisner A, et al. Utility of the photoplethysmogram in circulatory monitoring. Anesthesiology. 2008. doi:10.1097/aln.0b013e31816c89e1 Source
- Chung HU, et al. Skin-interfaced biosensors for advanced wireless physiological monitoring in neonatal and pediatric intensive-care units. Nat Med. 2020. doi:10.1038/s41591-020-0792-9 Source
- Seshadri DR, et al. Wearable sensors for COVID-19: a call to action to harness our digital infrastructure for remote patient monitoring and virtual assessments. Front Digit Health. 2020. doi:10.3389/fdgth.2020.00008 Source
- Mishra T, et al. Pre-symptomatic detection of COVID-19 from smartwatch data. Nat Biomed Eng. 2020. doi:10.1038/s41551-020-00640-6 Source
- Johnson AEW, et al. MIMIC-III, a freely accessible critical care database. Sci Data. 2016. doi:10.1038/sdata.2016.35 Source
- Park CY, et al. K-EmoCon, a multimodal sensor dataset for continuous emotion recognition in naturalistic conversations. Sci Data. 2020. doi:10.1038/s41597-020-00630-y Source
- Liu D, et al. University of Queensland vital signs dataset: development of an accessible repository of anesthesia patient monitoring data for research. Anesth Analg. 2012. doi:10.1213/ane.0b013e318241f7c0 Source
- Moraes JL, et al. Advances in photopletysmography signal analysis for biomedical applications. Sensors. 2018. doi:10.3390/s18061894 Source
- Speer KE, et al. Measuring heart rate variability using commercially available devices in healthy children: a validity and reliability study. Eur J Investig Health Psychol Educ. 2020. doi:10.3390/ejihpe10010029 Source
- Pimentel MAF, et al. Toward a robust estimation of respiratory rate from pulse oximeters. IEEE Trans Biomed Eng. 2017. doi:10.1109/tbme.2016.2613124 Source
- Goodale BM, et al. Wearable sensors reveal menses-driven changes in physiology and enable prediction of the fertile window: observational study. J Med Internet Res. 2019. doi:10.2196/13404 Source
- Lima A, Bakker J. Noninvasive monitoring of peripheral perfusion. Intensive Care Med. 2005. doi:10.1007/s00134-005-2790-2 Source
- Allen J, Murray A. Age-related changes in peripheral pulse timing characteristics at the ears, fingers and toes. J Hum Hypertens. 2002. doi:10.1038/sj.jhh.1001478 Source
- Pilt K, et al. Photoplethysmographic signal waveform index for detection of increased arterial stiffness. Physiol Meas. 2014. doi:10.1088/0967-3334/35/10/2027 Source
- Otsuka T, et al. Independent determinants of second derivative of the finger photoplethysmogram among various cardiovascular risk factors in middle-aged men. Hypertens Res. 2007. doi:10.1291/hypres.30.1211 Source
- IEEE. IEEE Standard for Wearable Cuffless Blood Pressure Measuring Devices (IEEE 1708-2014). 2014. doi:10.1109/ieeestd.2014.6882122 Source
- Ding X, et al. Pulse transit time based continuous cuffless blood pressure estimation: a new extension and a comprehensive evaluation. Sci Rep. 2017. doi:10.1038/s41598-017-11507-3 Source
- Lazazzera R, et al. Detection and classification of sleep apnea and hypopnea using PPG and SpO2 signals. IEEE Trans Biomed Eng. 2021. doi:10.1109/tbme.2020.3028041 Source
- Karmakar C, et al. Detection of respiratory arousals using photoplethysmography (PPG) signal in sleep apnea patients. IEEE J Biomed Health Inform. 2014. doi:10.1109/jbhi.2013.2282338 Source
- Charlton PH, et al. Extraction of respiratory signals from the electrocardiogram and photoplethysmogram: technical and physiological determinants. Physiol Meas. 2017. doi:10.1088/1361-6579/aa670e Source
- Torres-Soto J, Ashley EA. Multi-task deep learning for cardiac rhythm detection in wearable devices. NPJ Digit Med. 2020. doi:10.1038/s41746-020-00320-4 Source
- Perpetuini D, et al. Prediction of state anxiety by machine learning applied to photoplethysmography data. PeerJ. 2021. doi:10.7717/peerj.10448 Source
- Hina A, Saadeh W. A noninvasive glucose monitoring SoC based on single wavelength photoplethysmography. IEEE Trans Biomed Circuits Syst. 2020. doi:10.1109/tbcas.2020.2979514 Source
- Panwar M, et al. PP-Net: a deep learning framework for PPG-based blood pressure and heart rate estimation. IEEE Sens J. 2020. doi:10.1109/jsen.2020.2990864 Source
- Alavi A, et al. Real-time alerting system for COVID-19 and other stress events using wearable data. Nat Med. 2022. doi:10.1038/s41591-021-01593-2 Source
- Reiss A, et al. Deep PPG: large-scale heart rate estimation with convolutional neural networks. Sensors. 2019. doi:10.3390/s19143079 Source
- Dehkordi P, et al. Extracting instantaneous respiratory rate from multiple photoplethysmogram respiratory-induced variations. Front Physiol. 2018. doi:10.3389/fphys.2018.00948 Source
Quiet next step: Get Started when you want to plan raw PPG capture for a study or product.